> For the complete documentation index, see [llms.txt](https://docs.platform9.com/llms.txt). Markdown versions of documentation pages are available by appending `.md` to page URLs; this page is available as [Markdown](https://docs.platform9.com/self-managed-cloud-platform/5.11/managed-cluster-add-ons/management-cluster-monitoring.md).
# Workload Cluster Monitoring
This page covers the monitoring for the management cluster in SMCP.
## Deploying monitoring stack
Monitoring components for the management cluster in SMCP are packaged as a Helm chart. This helm chart is bundled with with Airctl dependencies.
The helm chart is located at `/opt/pf9/airctl/conf/helm_charts/` and can be found after the SMCP [auto$](https://github.com/platform9/pcd-docs-gitbook/blob/main/PEC/installation/README.md).
The name of the chart follows the pattern kube-prometheus-stack-62.7.1-9.tgz.
{% tabs %}
{% tab title="Bash" %}
```bash
helm install mgmt-monitoring -n pf9-monitoring /opt/pf9/airctl/conf/helm_charts/kube-prometheus-stack-62.7.1-9.tgz --create-namespace
```
{% endtab %}
{% endtabs %}
All monitoring pods status can be checked in `pf9-monitoring` namespace including Grafana, Alert-Manager, Prometheus etc.
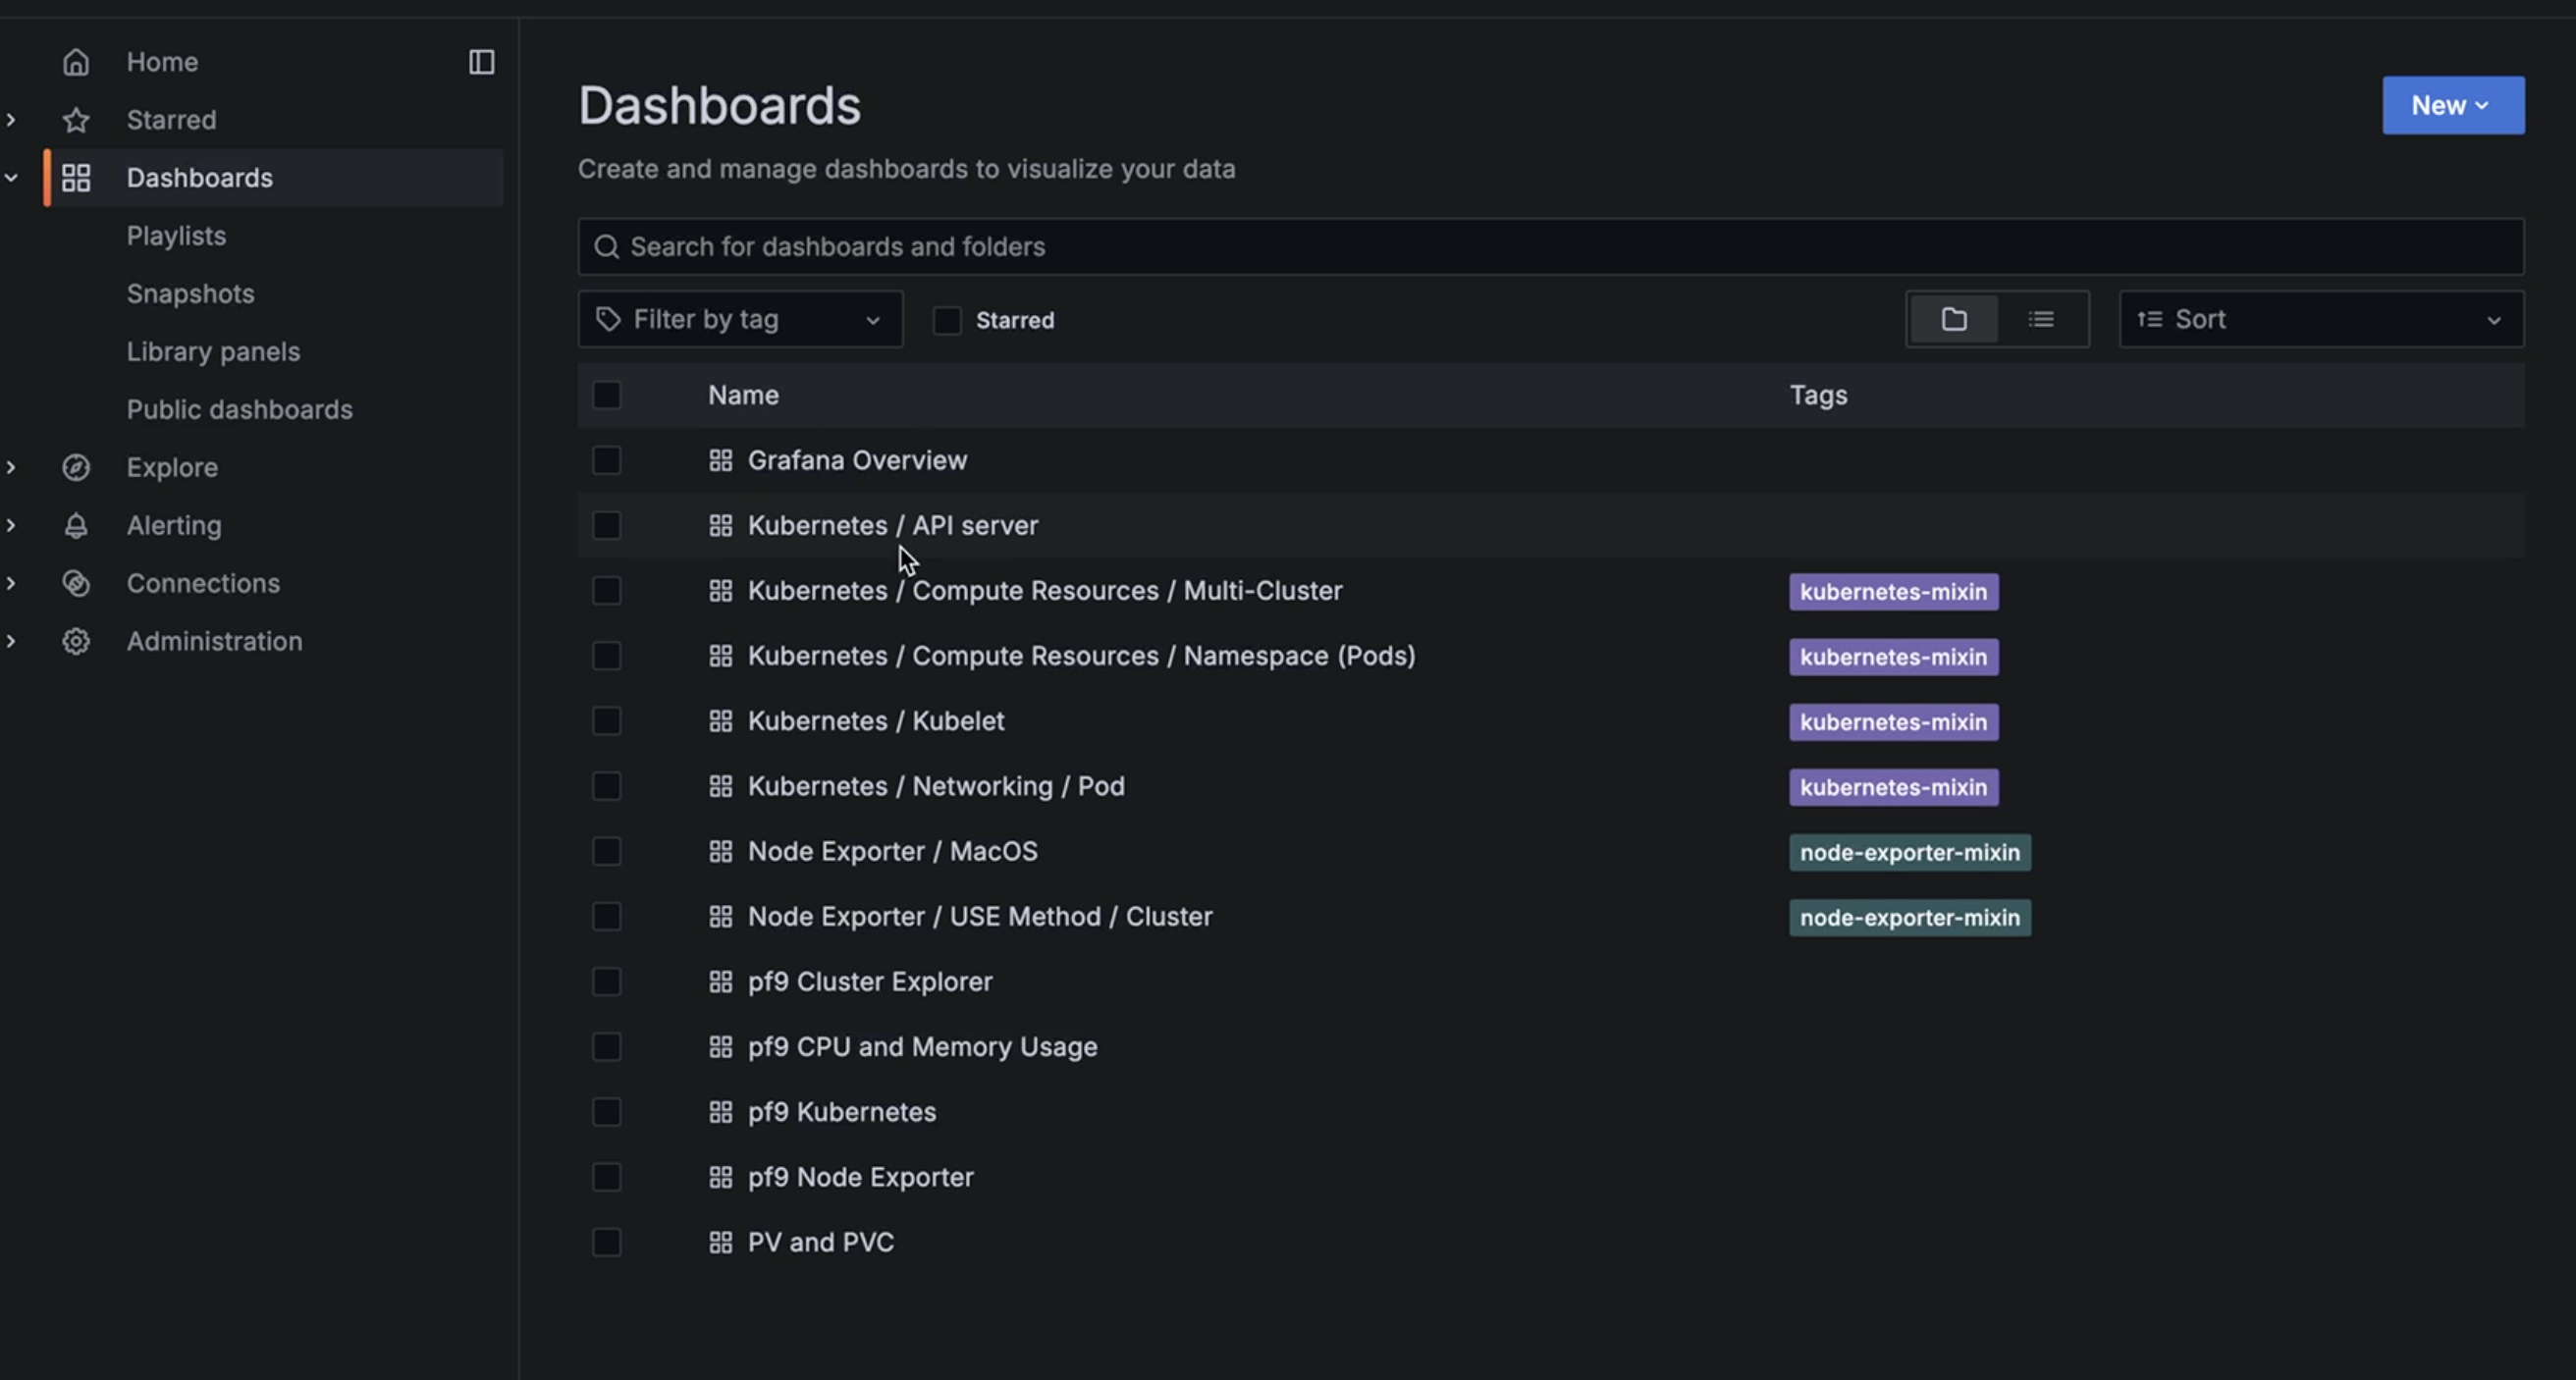
The deployed Grafana service already has dashboards pre-created for you to use. You can edit, add or remove by updating the helm chart.
## Configuring monitoring stack
You can configure the monitoring stack deployment by updating the helm chart `override.yaml` to update the defaults configured in values.yaml.
---
# Agent Instructions
This documentation is published with GitBook. GitBook is the documentation platform designed so that both humans and AI agents can read, navigate, and reason over technical content effectively. Learn more at gitbook.com.
## Querying This Documentation
If you need additional information that is not directly available in this page, you can query the documentation by asking a question.
Perform an HTTP GET request on the following URL with the `ask` and `goal` query parameters:
```
GET https://docs.platform9.com/self-managed-cloud-platform/5.11/managed-cluster-add-ons/management-cluster-monitoring.md?ask=&goal=
```
`ask` is the immediate question: it should be specific, self-contained, and written in natural language.
`goal` is what the user is ultimately trying to achieve, the reason they need the answer. Sharing it helps GitBook give you a better, more relevant answer. A goal is most helpful when it describes the outcome the user wants rather than restating the question. For example, with `ask=how do I create an API token`, a goal like `automate deployments from our CI pipeline` lets GitBook tailor the answer to that use case.
The response will contain a direct answer to the question and relevant excerpts and sources from the documentation.
Use this mechanism when the answer is not explicitly present in the current page, you need clarification or additional context, or you want to retrieve related documentation sections.