> For the complete documentation index, see [llms.txt](https://docs.platform9.com/llms.txt). Markdown versions of documentation pages are available by appending `.md` to page URLs; this page is available as [Markdown](https://docs.platform9.com/managed-kubernetes/5.13/bareos-what-is-bareos/platform9-managed-add-ons-overview/metrics-server-addon.md).
# Metrics Server Addon
## Introduction
The Kubernetes cluster Metrics Server addon is an aggregator of resource usage data in your cluster.
## Description
It is an open-source, scalable, and effective cluster addon that provides a means of collecting resource data (like memory and CPU usage) from the kubelet on each worker node. Additionally, it provides data for the Kubernetes Horizontal Pod Autoscaler when used for auto-scaling workloads. Once obtained, that info is exposed inside the Kubernetes API server via the Metrics API. It is an integral part of the core metrics pipeline.
{% hint style="warning" %}
**Warning**
Note: The Metrics Server addon is not meant for non-autoscaling purposes like Grafana or Prometheus monitoring.
{% endhint %}
## Settings
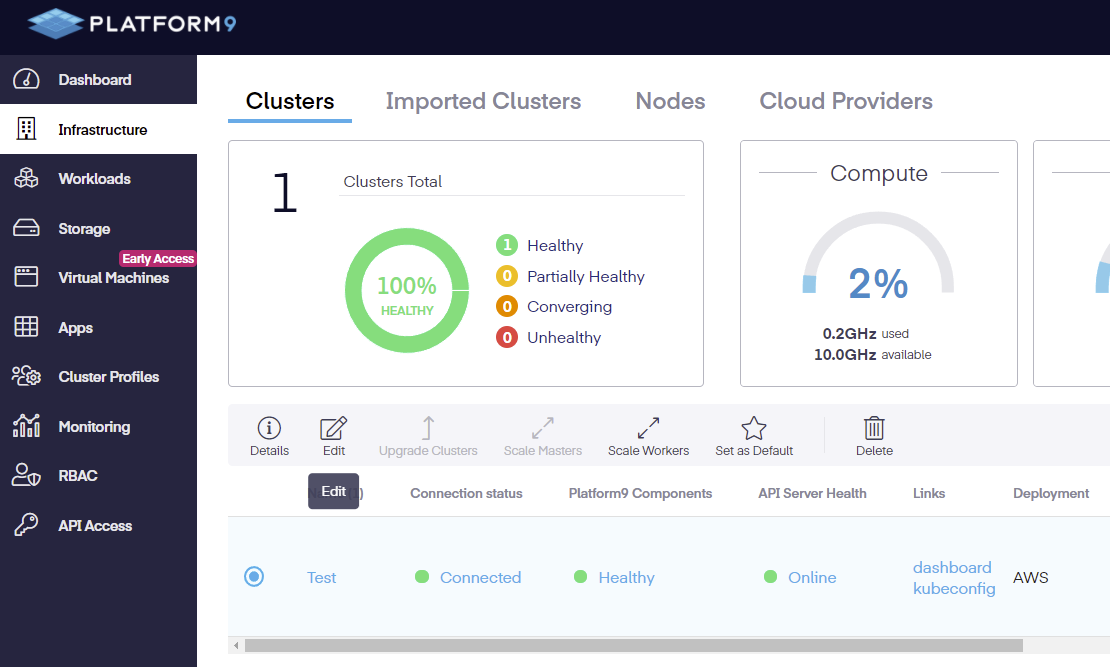
To access and modify the settings, go to the Infrastructure page, check the radio button next to the cluster you wish to modify, then click edit.
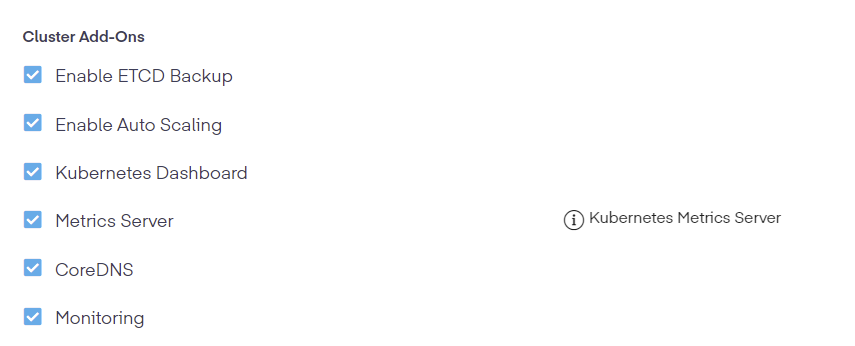
Once the new page is open, scroll down the where the cluster addon can be enabled.
## CLI
Once installed and activated, the Metrics API can then be accessed using the `kubectl top` command, making for easier debugging of various issues.
### Syntax
{% tabs %}
{% tab title="Bash" %}
```bash
kubectl top [flags] [options]
```
{% endtab %}
{% endtabs %}
### All Available Commands and Flags
{% tabs %}
{% tab title="Bash" %}
```bash
worker1.ubuntu@ip-10-0-1-140:~$ kubectl top
Display Resource (CPU/Memory) usage.
The top command allows you to see the resource consumption for nodes or pods.
This command requires Metrics Server to be correctly configured and working on
the server.
Available Commands:
node Display Resource (CPU/Memory) usage of nodes
pod Display Resource (CPU/Memory) usage of pods
Usage:
kubectl top [flags] [options]
Use "kubectl --help" for more information about a given command.
Use "kubectl options" for a list of global command-line options (applies to all
commands).
```
{% endtab %}
{% endtabs %}
### Example
{% tabs %}
{% tab title="Bash" %}
```bash
kubectl top pod --namespace web-app
NAME CPU (CORES) MEMORY (BYTES)
nginx-84ac2948db-12bce 14m 1Mi
nginx-84ac2948db-bc9ae 14m 1Mi
```
{% endtab %}
{% endtabs %}
## YAML Specifications
{% tabs %}
{% tab title="YAML" %}
```yaml
apiVersion: sunpike.platform9.com/v1alpha2
kind: ClusterAddon
metadata:
labels:
sunpike.pf9.io/cluster: ''
type: metrics-server
name: -metrics-server
namespace: default
spec:
clusterID: ''
override: {}
type: metrics-server
version: 0.5.0
watch: true
```
{% endtab %}
{% endtabs %}
## Conclusion
Addons are updated along with the `pf9-kube` version and can be referenced in the [Support Matrix](https://docs.platform9.com/kubernetes/support-matrix) article. For additional assistance, contact our [support team](https://platform9.zendesk.com/hc/en-us/requests/new?ticket_form_id=360000924873).
---
# Agent Instructions
This documentation is published with GitBook. GitBook is the documentation platform designed so that both humans and AI agents can read, navigate, and reason over technical content effectively. Learn more at gitbook.com.
## Querying This Documentation
If you need additional information that is not directly available in this page, you can query the documentation by asking a question.
Perform an HTTP GET request on the following URL with the `ask` and `goal` query parameters:
```
GET https://docs.platform9.com/managed-kubernetes/5.13/bareos-what-is-bareos/platform9-managed-add-ons-overview/metrics-server-addon.md?ask=&goal=
```
`ask` is the immediate question: it should be specific, self-contained, and written in natural language.
`goal` is what the user is ultimately trying to achieve, the reason they need the answer. Sharing it helps GitBook give you a better, more relevant answer. A goal is most helpful when it describes the outcome the user wants rather than restating the question. For example, with `ask=how do I create an API token`, a goal like `automate deployments from our CI pipeline` lets GitBook tailor the answer to that use case.
The response will contain a direct answer to the question and relevant excerpts and sources from the documentation.
Use this mechanism when the answer is not explicitly present in the current page, you need clarification or additional context, or you want to retrieve related documentation sections.